Who could have imagined 2020 as a year of unprecedented change and uncertainty? The closing of schools and statewide quarantine orders requires flexibility on the part of teachers. We’re still working–albeit from home.
I’ve been participating in staff as well as Specialist and Building Leadership team meetings through Google Hangouts (as a side note, some teachers use this online platform to meet with their classes). In many ways our conversations in these meetings relate to the new challenges we need to overcome in our profession. In other ways, our conversations return to the usual concerns of our field.
Your students may not be taking the SBA this year, but you will see plenty of other data on their academic performance. The data may come from iReady, DIBELS, MAPS, or another assessment preferred by your district.
The push in education is toward data informed instructional practices like the work done by John Hattie through Visible Learning. During PLCs, staff meetings, or as part of evaluations, teachers look through data–numbers, graphs, and percentages–to gauge student progress and plan for remediation or instructional changes. Now is the perfect time to analyze data and adjust instruction to accommodate for the needs of our students.
But please remember: every dot is a child.
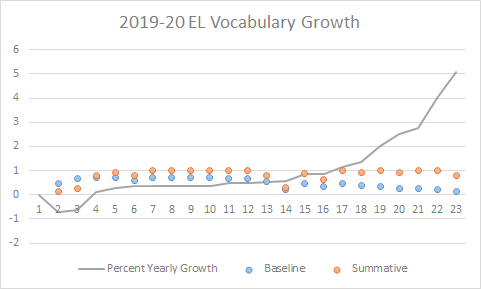
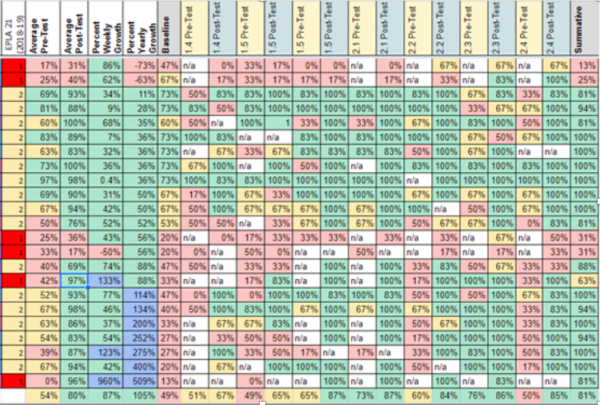
A few weeks ago I submitted my Student Growth Goals. This year I focused on tracking growth in the vocabulary of my fourth grade English Language learners. All of my students improved significantly from baseline to summative assessment except for two. These two students made negative growth–a slide backward of more than 30% from baseline to summative. They made a percentage yearly growth of more than -60%.
How did this happen? Was I such a terrible teacher that these students literally lost more than half the vocabulary knowledge they had before stepping into my classroom?
Keep in mind: every number is a child.
When creating data sheets, I input side columns to help paint a full picture of the child which, depending on the type of data I’m looking at, may include:
- Oral reading fluency score
- SPED status and types of services
- Speech services
- Title services
- English proficiency score
- Year of first enrollment in U.S. school
When taking a holistic view of my student growth data, the two students made progress. As ridiculous as it sounds, my two students experienced incredible luck on the baseline assessment, which masked their actual growth. The numbers tell me these students actually lost knowledge when personal interaction with them tells me something completely different. Their original scores were due to blind guess work as statistics show students can get some answers right on multiple choice questions without actually knowing the material. The claim that these students were simply “lucky” on the baseline may seem absurd–an excuse. Then, what makes me draw this conclusion?
Remember: there is a child behind every piece of data.
These two students both score at a Level 1 in English proficiency. Both of them first enrolled into a U.S. school in September of this school year. Yes, one of these students scored a 67% on the baseline assessment of fourth grade level academic vocabulary after being in the country for less than two months. From the baseline to summative assessment, my team and I watched him bloom. His basic interpersonal communication skills improved. He could now tell us what he did over the weekend and of issues at recess in short, simple sentences. However, he scored only 25% on the summative assessment. The other student shares a similar story.
I didn’t always consider other information points when looking at data. As a first year teacher, I would match what I knew of the child compared to the data, then drew my conclusions from there. This method left me blinded by my own assumptions.
In November of my second year as an EL Specialist, a fourth grade teacher voiced their concern over an EL student who scored significantly lower in iReady compared to her peers. I worked with this student on her Basic Interpersonal Communication Skills. I knew her to be bright and thoughtful. I explained the student in question transferred to our school in early May of third grade and scored a Level 1 in English Proficiency. We needed to give at least another year before making assumptions about her learning progress–little expecting I was doing just that.
The conversation wouldn’t leave my mind even though my past experience as an EL student, endorsement, and available data affirmed my assessment. Checking the student’s file raised red flags. Yes, the student transferred just as I said, but before that she spent more than two years in a neighboring school district. Her date of entry into the United State completely changed my perspective of the situation. Upon contacting her teacher, we looked at the data with a new perspective and decided to bring the student up to the Guidance Team for a SPED referral.
Now when I work with data I keep in mind that every dot and number is a child. There may be more to the picture than suggested.
What about you? Have you consistently remembered the child behind that dot?
Numbers have names…this was a phrase I heard years ago in a seminar about data and it has stuck with me. It is going to be such an interesting time in our state as we set out to start a fresh year if indeed schools are canceled until next school year. I wonder how we will use data to determine just where we should start in September. Regardless of the approach we take, we will be wise to remember that indeed, numbers do have names.
Right? With everything that’s happening, we will definitely need to think of new data points when grouping students next year…or even if we do come back this school year! How much learning has been lost?
I feel very lucky to work in a building where the dots and data have stories. We’re small, the principal knows every kid, we have one hallway… it is pretty impossible to see dots and data without seeking a kid in our minds the next moment, so we’re lucky. What has been great is whenever we have “data conversations” or talk about our “student growth goals,” we can’t help but talk about the individual people and the stories the dots and data are actually telling. I really feel like this is how it ought to be.
That is definitely a benefit of working in a small school. Unfortunately, once student numbers increase it’s hard to keep things in perspective or completely understand a student’s story without that personal connection.