For some reason, my heart has always been with “those kids.” The ones who sneer at you the first time you meet them. The ones who push buttons and boundaries. The frequent fliers in the “tank” (In School Suspension) and who know the campus security guards far too well.
I was talking to the principal at the smaller of the two high schools in our district recently, and without consulting my brain, my mouth spoke my truth: What a privilege it is for me to be the adult for that kid at whom they can scream “F— you, Mr. Gardner!” And then tomorrow, we can talk it through and figure out where that came from; I can teach about repairing relationships, and we can strategize how to handle it better next time…and the time after that…in a safe place where they won’t be risking their paycheck or their marriage or their freedom; in a safe place where they can start to learn some important lessons that don’t show up in the Common Core.
Read no sarcasm here, I mean it: What a privilege that I get to be that person.
While I think I’m a pretty good teacher of the academic stuff, I think what has made me successful is the way I handle moments like that. I don’t always do it perfectly; none of us do. The idea of student discipline is one that I often think over, and in particular in my role this year as a new-teacher mentor. Classroom management and discipline, creating those safe, productive educational spaces, are central lessons for the beginning of a teaching career. Recently, at a conference related to the Beginning Educator Support Team (BEST) program here in Washington, this topic of how teachers handle student behavior was at the core.
It was at this conference that I was handed some data that did what data is supposed to do: It made me think.
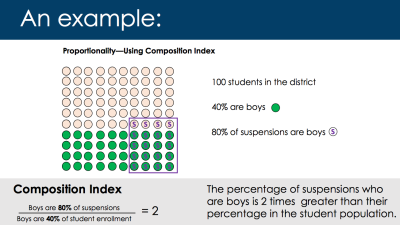
This data was based on what was referred to as the “composition index.” Below is a graphic (from a presentation from “Improving Equity in Student Discipline” by Sechrist, Albertson, and Lynch at OSPI, full source at this link) that helps to explain what the composition index means:

(click to enlarge)
So when looking at data using a composition index, any subgroup with an index number greater than one means that the subgroup is experiencing a disproportionately higher rate of exclusionary discipline relative to their proportion in the total population (and less than one, a lower rate).
The intention of sharing this data with most of the districts in attendance was to help them notice whether students of color were experiencing exclusionary discipline at a disproportionate rate, and then to wonder at the reasons this might be.
For my district, which is so homogenous (white) that in most cases the n for race subgroups was too small to draw statistically valid conclusions, there didn’t emerge a significant discrepancy based on race. However, two groups in the disaggregated data had compositions:
- Our low-income students had a composition index of 2.42, which means the percentage of suspensions of low-income students is 2.42 times greater than their percentage in our student population.
- For our non-504 special education students, the composition index was 2.63.
An index of 2.42 for low-income students and 2.63 for special education students: I have no answers, only questions.
I’m oversimplifying, but often when there is a disproportionate expulsion rate for non-white students, the thread can be drawn back to teacher responses based on overt or unintentional racial biases. (The research shared also included data about how children of color were more severely punished for the same offense as compared the their white classmates.) It is easy to then argue that these biases are triggered by outwardly visible differences (race), and thus it is easier to blame cultural biases for how educators respond in a disparate way to student behavior.
Differentiating between a low-income student and a non-low-income student isn’t so obvious as noticing race. One could claim to use clothing as an indicator, but in my experience it is a highly unreliable one. Similarly, outward appearances don’t make obvious a student served by an IEP.
So more questions:
- Are there certain patterns of behavior that our low-income students or special education students presenting that our teachers are not adequately equipped to recognize and respond appropriately to?
- Are higher-income students “getting in trouble” at similar rates, but simply not receiving exclusionary discipline, whereas low-income students are excluded? If so, is it a parent advocacy factor? Do we bend to the will of more affluent parents who know how to storm the main office to demand the repeal of Little Precious’s punishment?
- Do we have a high number of students who operate in both subgroups, perhaps resulting in compounded concerns?
- And the biggest: What does awareness of these indexes mean for the classroom teacher?
That last one is the only one I feel I can begin to answer. And the answer isn’t about student behavior, it is about teacher behavior: our patterns of response to what behaviors manifest from our students. The events that precipitate that data around exclusionary discipline start in the classroom with how a teacher responds to the first visible moment of presenting behavior. Do we respond differently to different students, and not even know why? With certain kids do we engage? Escalate? Allow a power struggle or battle of wills? Do we move more quickly with some kids than others to punish, a word supposedly synonymous to discipline, even though the latter word actually comes from a root meaning to provide instruction and knowledge not retribution and penalties?
Like I said above, I don’t do it perfectly, but at least I’m aware. The rule I try to follow in my own practice, and the one I try to encourage my new teachers to adopt, is that the moment of “misbehavior” never occurs in isolation. That moment occurs within a constellation of other moments, most of them invisible and not even within the walls of my room. Once I seek to understand the universe that is that kid’s life, I can’t help but want my next step to be about instruction rather than punishment.
And still, many questions. Few answers.
(Want to find your data? Go to this link, then scroll down under “Data Files” and download the Excel file in the first link. Go to the “Summary” tab, and you’ll figure it out.)

I work in a school with nearly half the students free and reduced lunch. We’ve all been getting ACES training this year. What stood out to me was the idea that instead of focusing on “What did you do?” we should start by asking “What happened to you?” Understanding the roots of the behavior will help us deal with the students more compassionately–instead of immediately leaping to suspension.
Our staff at Yelm Middle School recently viewed the “Paper Tigers” documentary about an alternative high school in Walla Walla, WA, that implemented a “trauma-informed” approach to student behavior based on ACES (Adverse Childhood Experiences) research. It was a powerful start to the conversation on restorative practices and how to build an awareness into practice. View the trailer here: http://kpjrfilms.co/paper-tigers/
We also are looking at Compassionate Schools research you can find on the OSPI website and the Six Principles to creating a Compassionate School: http://www.k12.wa.us/compassionateschools/
One in four students has experienced significant trauma (four or more ACES). This is a critical subgroup to examine with the Composition Index, and other discipline data. As usual, Mark, I appreciate your respectful and measured approach to what works best for student learning and growth.
I hope all is well in Yelm, Craig!
I just saw Paper Tigers for the first time recently, and I’ve been working on and off with a team from Marysville’s Quil Ceda Tulalip Elementary as teacher-leaders work to implement their school’s compassion plan that involves rethinking “reactive” discipline in favor of understanding the impact of the experiences in their lives outside the school walls.
The large comprehensive high school in my district (the school where I taught for 12 years) has many strengths, and performs exceptionally well academically, but I think we could benefit from seriously considering how many students bring those ACES that we teachers need to be better equipped to respond to… It makes me wonder if there is also a correlation between “high achieving” schools (based on AP scores, and so on) and a composition index that shows exclusion of certain populations. Just a wonder, not an accusation…